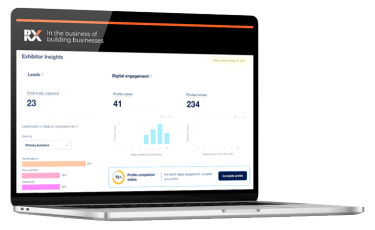
Exhibitor Dashboard offers a data driven approach to measuring your performance and insights for improvements.
Exhibitor Dashboard
Use this new analytics tool to get an idea of how many competitors have similar product offerings; identify potential ways to boost your digital performance; gauge where you rank aginst direct competitors and qualify potential customers using interest based data insights.
Five steps to benchmarking performance
- Review and download details of leads captured at show
- Analyse leads by segment of interest e.g. job title, region, product interests
- Review metrics for online visitor engagement with your company
- Analyse engagement trends over time
- Analyse visitor response to recommendations made for your company
The Exhibitor Dashboard gives you visibility into quantifiable business values. With the dashboard, you can:
- Quantify your company profile views and leads captured through the event
- View and download leads scanned at the show
- Split view leads by dimensions of interest
- Assess online visitor engagement with your company and products/services over time
- View matchmaking recommendations made to visitors by RX on your behalf through different channels
Also, you can upgrade to Exhibitor Dashboard Pro and compare your performance with competitors and identify areas of improvement.